

Status pages overview
A status page is a public page that shows your users the current and past health of your services. Instead of customers emailing “is it just me?”, they check the page; during an outage you post one update there, and everyone who subscribed hears about it.
A status page is built from monitors you already run in HostTracker. Each monitor you add becomes a component with a live state and an uptime history. You can also add third-party components - dependencies you do not monitor, whose state you set by hand.
Where it lives
Section titled “Where it lives”Every page has a permanent slug you choose when you create it, and is served at:
https://status.host-tracker.com/<slug>https://www.host-tracker.com/status/<slug>Both addresses show the same page. Your own domain (status.example.com) is planned but
not available yet.
What visitors see
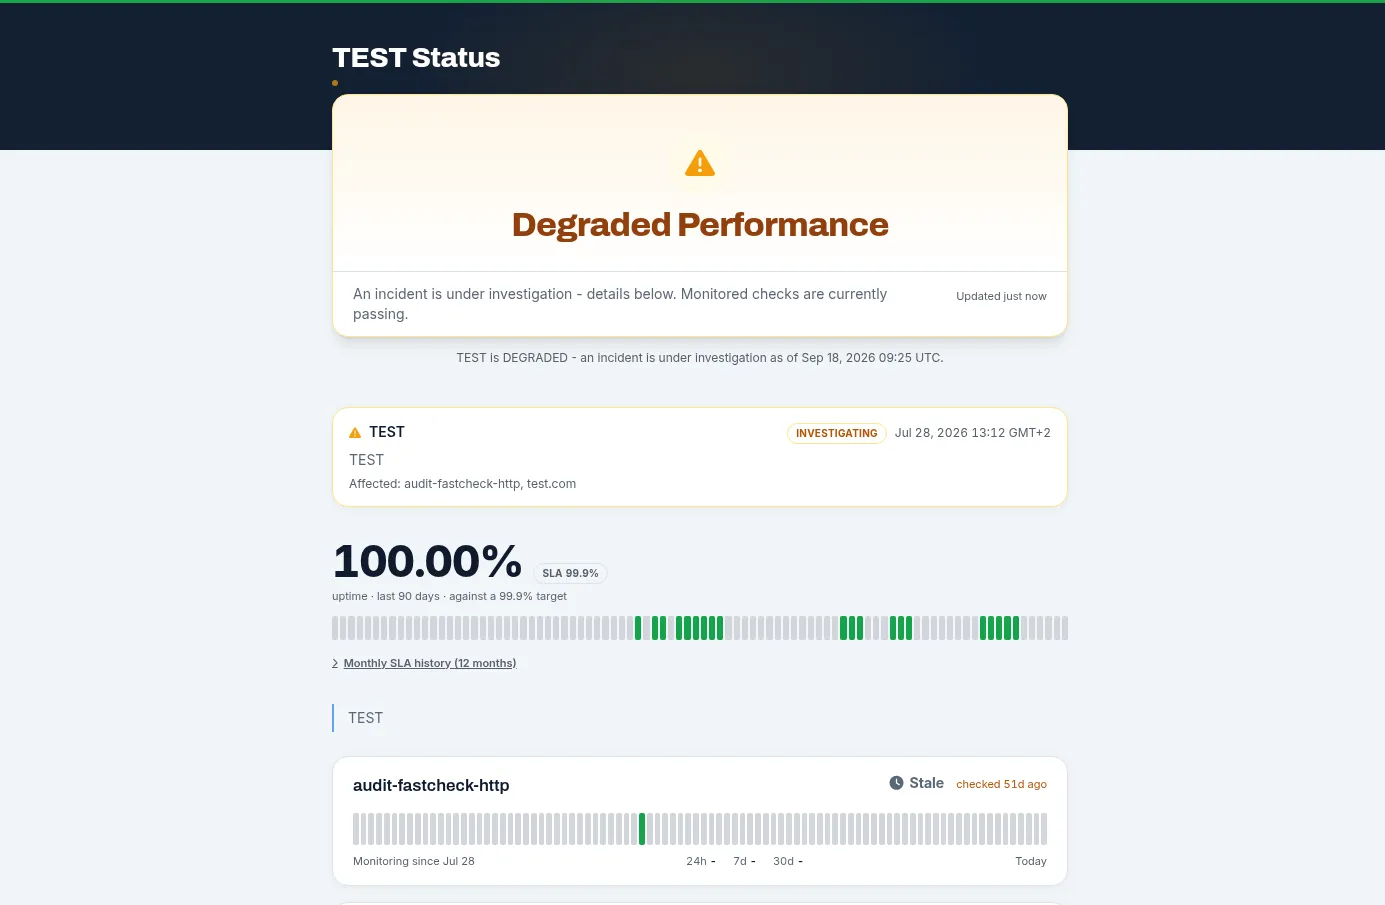
Section titled “What visitors see”- An overall status banner - “All Systems Operational”, “Degraded Performance”, “Partial Outage” or “Major Outage”, or a maintenance notice - worked out from the components and any open incidents.
- Open incidents and maintenance at the top, with their timeline of updates.
- One row per component with its state, uptime percentage and a 90-day uptime bar; days covered by maintenance are drawn in blue.
- Optional: an SLA target with an error budget and a 12-month compliance history, response-time charts, per-service
pages, a history of past incidents, a subscribe button, RSS/Atom feeds and a
status.jsonlink. - A “Powered by HostTracker” credit in the footer, which is shown on every page and cannot be removed.
What is shown is up to you: see Appearance and branding.
What you can do
Section titled “What you can do”- Create a status page and pick its address, name and access settings.
- Add and group components from your monitors, plus third-party components.
- Style it with your logo, colours and layout.
- Password-protect a page meant for a team or a single client.
- Post incidents, maintenance and announcements in your own words.
- Let visitors subscribe by email, and push updates to your own Slack, Microsoft Teams or webhook.
- Embed a status card or badge, and read
status.json, RSS/Atom feeds and the SLA export.
How it relates to monitors, incidents and maintenance
Section titled “How it relates to monitors, incidents and maintenance”| Source | Shows on the page as |
|---|---|
| A monitor’s checks | The component’s live state and uptime bar. A confirmed outage is listed as a monitoring-detected outage. |
| An incident you declare on the page | A panel with your title, impact and timeline; subscribers are notified. |
| A maintenance window with Show on status page on | A blue maintenance panel from 7 days before it starts, and blue days on the uptime bars. Details. |
| A scheduled maintenance you declare on the page | A maintenance panel with your words; subscribers are notified. |
A monitor incident is created by the checking engine when a monitor goes down; a status page incident is what you tell your visitors. They are separate records - see What is an incident.
Ways to manage status pages
Section titled “Ways to manage status pages”- In the app: Status pages in the sidebar (
/status-pages). - Through the REST API under
/statuspagewith thestatuspage:readandstatuspage:writescopes. - From an AI assistant through MCP:
list_status_pages,get_status_page,create_status_page,update_status_page,delete_status_page,create_status_page_incident,add_status_page_incident_update. - As code with the Terraform provider (
hosttracker_status_page).
The page password and the custom domain are managed in the app only.
Plan limits
Section titled “Plan limits”Every plan can publish at least one status page. How many pages, components per page and confirmed subscribers you get, and whether you can use an SLA target, your own Google Analytics ID and search-engine opt-out, depends on how many monitors your plan includes - see Status page plan limits.