

Monitor page load in a real browser (Page speed monitor)
The Page speed monitor (API type waterfall, also accepted as pageSpeed) loads your page in a real
Chromium browser from the locations you choose and records every request the page makes - a full waterfall of
timings - plus CPU, memory and console messages. You set thresholds; the check fails when the page breaks one.
Use it when how the page loads matters, not just whether the server answers: a broken third-party script, a
missing stylesheet, a page that takes 30 seconds to finish.
At a glance
Section titled “At a glance”| API type token | waterfall (input alias pageSpeed) |
| Runs from | HostTracker’s browser checkpoint fleet - you pick the locations |
| Intervals in the app | 10, 15, 30, 45 minutes, 1, 2, 4, 6, 12, 24 hours, or a cron schedule |
| Default interval | 15 minutes in the app; through the API send 600 or more (the type’s minimum is 10 minutes) |
| Plan gates | the Page speed type is a package feature (waterfall) and can have its own monitor count, shown under the save button as “N of M Waterfall monitors” |
How Down is decided
Section titled “How Down is decided”The check always fails when the browser cannot load the page (a navigation error or timeout) or the main document answers with status 0 or 400 and above. On top of that, each threshold you set fails the check:
- counts (failed documents, scripts, images, console errors…) fail when the count reaches the threshold;
- the two time budgets fail when the page (or the page without XHR) takes at least that long;
- CPU and memory fail when more than 3 performance samples exceed the threshold, so a brief spike is ignored.
A threshold of 0, or an absent field, is off. A resource counts as failed when it never finished or answered with status 0 or 400 and above. A failed check is re-checked from other locations before the monitor turns Down.
Settings reference
Section titled “Settings reference”The name, interval, cron, tags, Full Log, Open Stats, subscriptions, recheck strategy and locations work as described in Common monitor fields.
| Setting (app label) | API field | Type / allowed values | Default | Plan limits | What it does for you |
|---|---|---|---|---|---|
| Domain/IP | url |
URL or domain | required | - | The page to load. |
| Device emulation (Page Configuration) | settings.deviceEmulation |
a device name from GET /check/device (MCP list_check_types) |
Desktop |
- | Viewport, user agent and touch emulation of that device. |
| Page load timeout (Page Configuration) | settings.timeout |
milliseconds, 0-40000 (app 1-40 s) | app: 20000; API: off | - | Fails the check when the page takes at least this long to finish loading. |
| Document/IFrame loading fail threshold | settings.onDocument |
0-50 | app: 1; API: off | - | Fails when this many documents or iframes fail to load. |
| CPU usage threshold | settings.onCpu |
80-100 (percent) | none | - | Fails when the page’s CPU use stays above this value. |
| Memory usage threshold | settings.onRam |
0-1000 (MB) | none | - | Fails when the page’s memory use stays above this value. |
| Client-side errors threshold | settings.onConsoleError |
0-50 | off | - | Fails when this many console errors occur. |
| Client-side warns threshold | settings.onConsoleWarning |
0-50 | off | - | Fails when this many console warnings occur. |
| Page load timeout without XHR (Content Load Checks) | settings.xhr |
milliseconds, 0-40000 | off | - | Fails when the page, not counting XHR/fetch requests, takes at least this long. |
| Total load fails threshold | settings.totalCount |
0-50 | off | - | Fails when this many resources of any kind fail to load. |
| Script load fails threshold | settings.onScript |
0-50 | off | - | Same, for scripts only. |
| Stylesheet load fails threshold | settings.onStylesheet |
0-50 | off | - | Same, for stylesheets. |
| Image load fails threshold | settings.onImage |
0-50 | off | - | Same, for images. |
| Font load fails threshold | settings.onFont |
0-50 | off | - | Same, for fonts. |
| AJAX request fails threshold | settings.onAjax |
0-50 | off | - | Same, for XHR/fetch requests. |
| Recheck strategy, If selected locations are unavailable | recheck, locations.fallback |
as on the Website monitor | majority vote, starve |
- | How failures are confirmed. |
An out-of-range value is refused (422 invalid_settings), never clamped.
Set it up in the app
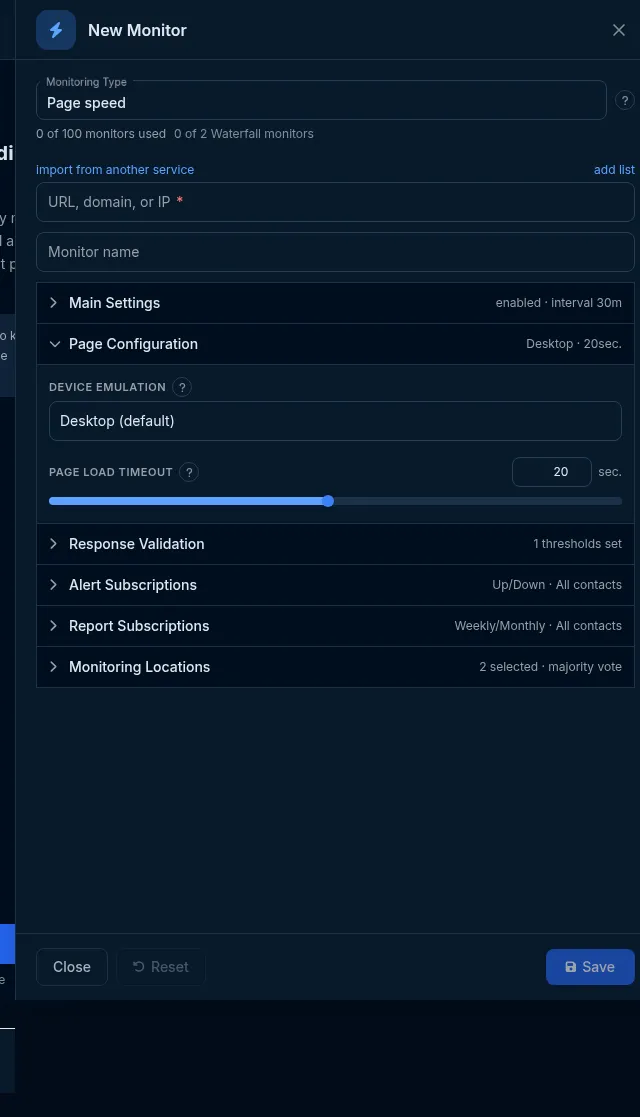
Section titled “Set it up in the app”- On the Sites dashboard, click Add Monitor and choose Page speed in Monitoring Type. A type that is not in your package is marked not in your package.
- Enter the page in Domain/IP and a name.
- In Page Configuration, pick a Device emulation and set the Page load timeout.
- In Response Validation, set the Page health and Content Load Checks thresholds you care about.
- Pick browser locations in Monitoring Locations and click Save.
Do it with the API or MCP
Section titled “Do it with the API or MCP”curl -X POST https://api2.host-tracker.com/monitor \ -H "Authorization: Bearer $HT_TOKEN" -H "Content-Type: application/json" \ -d '{ "type": "waterfall", "url": "https://www.example.com/", "interval": 900, "locations": { "pools": ["allworld"] }, "settings": { "timeout": 20000, "onDocument": 1, "onScript": 1, "onConsoleError": 5 } }'Update - test as a phone and tighten the budget:
curl -X PATCH https://api2.host-tracker.com/monitor/<monitor-id> \ -H "Authorization: Bearer $HT_TOKEN" -H "Content-Type: application/json" \ -d '{ "settings": { "deviceEmulation": "<device from GET /check/device>", "timeout": 10000 } }'MCP (interval is passed to the API as-is, in seconds):
create_monitor(type="waterfall", url="https://www.example.com/", interval=900, pools="allworld", settingsJson="{\"timeout\":20000,\"onDocument\":1}")Use list_check_types to see the device names.
Recipes
Section titled “Recipes”- Page must load within 10 seconds -
timeout: 10000. - Catch a broken script or stylesheet -
onScript: 1,onStylesheet: 1. - Catch JavaScript errors -
onConsoleError: 1(or a higher count to tolerate known noise). - Mobile experience - pick a phone profile in Device emulation.
- Main content must be there fast, analytics may lag -
xhr: 8000with a longertimeout.
What happens next
Section titled “What happens next”Each check stores the full waterfall - every request with its timing and status - which you can open from the monitor’s statistics. A broken threshold is re-checked from other locations, then opens an incident and alerts the subscribed contacts.
Limits and gotchas
Section titled “Limits and gotchas”- Omitting
intervalon create uses 180 seconds, which is below this type’s 10-minute minimum and is refused (422). Always sendintervalof 600 or more. 403 package_limit- your package does not include Page speed, or its Page speed monitor count is used up.422 invalid_settings- an unknown device name or an out-of-range threshold.locations.poolsis required on create.- Page speed, Content check and Transaction monitors all run on the browser fleet; each type can have its own package count.