

Monitor CPU, RAM and disk (Counter monitor)
The Counter monitor (API type counter, shown in the app as Monitor CPU, RAM, HDD) reads one number from
your own server - CPU load, memory use, disk use, a port or database connect time, a Windows performance counter,
or any value your own web service reports - and alerts when it breaks a threshold. HostTracker calls a small
endpoint you host; nothing is installed or pushed by HostTracker.
At a glance
Section titled “At a glance”| API type token | counter |
| Runs from | HostTracker’s own internal check network - no location picker, no recheck |
| Intervals in the app | 1 minute to 24 hours, or a cron schedule |
| Default interval | 3 minutes |
| Plan gates | the Counter type is a package feature (counterTask) |
How it works and how Down is decided
Section titled “How it works and how Down is decided”On each check HostTracker POSTs a small JSON request to your endpoint and reads the answer. The endpoint is one of:
- HostTracker collector - ASP.NET 4.0, for IIS/Windows (
aspnet4) - download it from the editor and deploy it; HostTracker calls<Base monitor url>/host-tracker-monitor.ashx. The application pool must be able to read performance counters. - HostTracker collector - PHP, for *nix web servers (
php) - HostTracker calls<Base monitor url>/host-tracker-monitor.php. PHP needsshell_execand permission to runtop,free,df. - Value provider - your own web service (
custom) - HostTracker calls the Full monitor url as is. Your service answers with JSON{"v": 12.34, "e": "error text", "vs": "version string"}; at leastvoremust be present.
Each request waits up to 25 seconds and is retried up to 2 times. Then:
- An unreachable endpoint, a bad answer or an
eerror is a failure and turns the monitor Down. - A value that breaks the Error condition is an overload. The monitor turns Down after Overloads before Down consecutive overloads (0 = on the first one).
There is no multi-location recheck; the result from the internal checkpoint is final.
Settings reference
Section titled “Settings reference”The name, interval, cron, tags, Full Log, Open Stats and subscriptions work as described in
Common monitor fields. Do not send locations.
| Setting (app label) | API field | Type / allowed values | Default | Plan limits | What it does for you |
|---|---|---|---|---|---|
| Value provider | settings.monitorType |
custom, php, aspnet4 |
custom |
- | Which endpoint HostTracker calls (see above). |
| Full monitor url / Base monitor url | settings.probeUrl |
URL or host | required | - | Where the endpoint lives. The monitor’s url is composed from it and the metric; send probeUrl alone. |
| Counter type | settings.counterType |
cpu (CPU usage, %), ram (RAM usage, %), disk (Disk or file system usage, %), port (Port connection time, ms), mssql (SQL Server connection time, ms), mysql (MySQL connection time, ms), perfCounter (Windows performance counter) |
cpu |
- | The metric the collector measures. Ignored for custom. mssql and perfCounter need the ASP.NET collector. |
| Logical disk / File system | settings.label |
1-255 characters | required for disk |
- | Which drive (Windows) or mount point (*nix). |
| Host : Port | settings.host, settings.port |
host 1-1000 characters; port 0-65535 | port 80 | - | The target of a port connect-time counter. |
| Connection string | settings.connectionString |
1-255 characters; handled as a secret | required for mssql/mysql |
- | The database to time the connection to. |
| Counter category, Counter name, Counter instance | settings.category, settings.name, settings.instance |
1-255 characters (instance optional) | instance: default instance (often _Total) |
- | The Windows performance counter to read. |
| Error condition | settings.errorCondition |
no, eq, ne, gt, ls, ge, le, in, out, ine, oute, ine1, ine2, oute1, oute2 |
no |
- | When a value counts as an overload. no (no condition) only collects the value. |
| limit / bottom limit / top limit | settings.errorLevel1, settings.errorLevel2 |
numbers; errorLevel1 must not exceed errorLevel2 |
none | - | The threshold values. |
| Overloads before Down | settings.errorCheckCount |
0-100 | 0 | - | Consecutive overloads needed before the monitor turns Down. |
| (API only) deployment | settings.deploymentType |
manual |
manual |
- | You deploy the collector yourself. |
Error condition values (the app shows equals, not equal to, less than, greater than, inside range, outside range; the API also has the inclusive variants):
| Value | Overload when |
|---|---|
eq / ne |
value = / != errorLevel1 |
gt / ge |
value > / >= errorLevel1 |
ls / le |
value < / <= errorLevel1 |
in |
errorLevel1 < value < errorLevel2 |
ine |
errorLevel1 <= value <= errorLevel2 |
ine1 / ine2 |
lower bound inclusive / upper bound inclusive |
out |
value < errorLevel1 or value > errorLevel2 |
oute |
value <= errorLevel1 or value >= errorLevel2 |
oute1 / oute2 |
as out, with the lower / upper bound inclusive |
The editor also shows Retry on connect fail for this type; it has no API field, and the check always retries as described above.
Set it up in the app
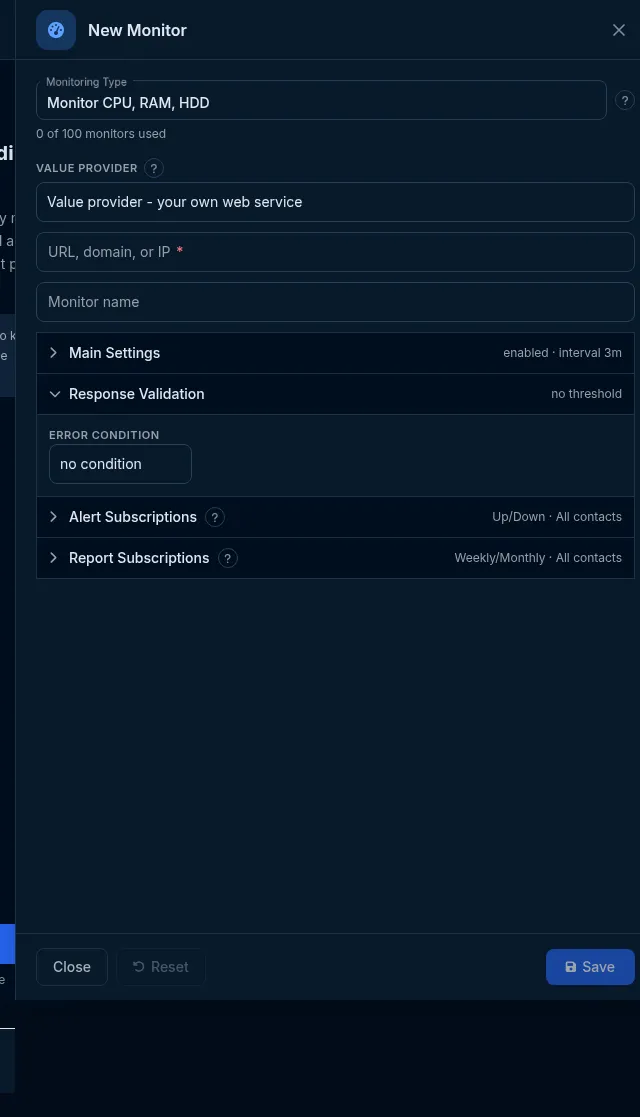
Section titled “Set it up in the app”- On the Sites dashboard, click Add Monitor and choose Monitor CPU, RAM, HDD in Monitoring Type.
- Choose the Value provider. For a collector, click Download collector (PHP) or Download collector (ASP.NET) and deploy it on the server.
- Enter the Base monitor url (collector) or Full monitor url (your own service).
- In Response Validation, choose the Counter type and its fields, the Error condition and limits, and Overloads before Down.
- Click Save.
Do it with the API or MCP
Section titled “Do it with the API or MCP”curl -X POST https://api2.host-tracker.com/monitor \ -H "Authorization: Bearer $HT_TOKEN" -H "Content-Type: application/json" \ -d '{ "type": "counter", "name": "web-1 CPU", "interval": 300, "settings": { "monitorType": "php", "probeUrl": "https://web-1.example.com/ht", "counterType": "cpu", "errorCondition": "gt", "errorLevel1": 90, "errorCheckCount": 3 } }'Your own service instead of a collector:
{ "type": "counter", "name": "Queue depth", "interval": 60, "settings": { "monitorType": "custom", "probeUrl": "https://ops.example.com/metrics/queue", "errorCondition": "gt", "errorLevel1": 500 }}Update - require 5 overloads in a row:
curl -X PATCH https://api2.host-tracker.com/monitor/<monitor-id> \ -H "Authorization: Bearer $HT_TOKEN" -H "Content-Type: application/json" \ -d '{ "settings": { "errorCheckCount": 5 } }'MCP: create_monitor(type="counter", name="web-1 CPU", interval=300, settingsJson="{...}") with the same
settings object and no pools.
Recipes
Section titled “Recipes”- CPU above 90% for 15 minutes -
counterType: cpu,gt90, interval 300,errorCheckCount: 3. - Disk almost full -
counterType: disk,label: "C:"or"/",gt85. - Slow database connections -
counterType: mysqlwith a connection string,gt500 (ms). - Any business number -
customprovider returning{"v": <number>}.
What happens next
Section titled “What happens next”The value from every check is stored and charted in the monitor’s statistics, so the Counter is also a simple metric history. Overloads and failures alert the subscribed contacts once the monitor turns Down.
Limits and gotchas
Section titled “Limits and gotchas”422 invalid_settings- a required field missing for the chosen counter type,mssql/perfCounterwith the PHP collector, orerrorLevel1greater thanerrorLevel2.422 validation_failedwithreason: pool_not_supported_for_type- omitlocations.403 package_limit- your package does not include Counter monitors.- The endpoint must accept requests from HostTracker’s internal check network (the source IPs are listed in the Database monitor’s editor).